Install Xdebug
When it comes to PHP programming having the possibility to use a debugger to track problems in your code is a necessity. One of the most popular one in the PHP ecosystem happens to be XDebug.
XDebug With Phpfarm
When using Phpfarm, XDebug has to be installed separately for each version. Hereunder are the explanation on how to do this, you'll have to repeat the process for each version of PHP you've installed.
Quite obviously, you'll have to adapt the version number in the examples to fit your situation.
Getting the package
XDebug can be downloaded in a variety of versions or even built from sources.
Although the easiest way to get it running is using Xdebug's website installation wizard that will help you determine what to do to get XDebug working on your system. Follow the simple instructions and you'll soon have XDebug installed and running.
First refer to this section of the wiki to have PHP output it's configuration summary, and copy/paste it in the above mentioned XDebug wizard.
This will show the link that can be used to download the appropriate XDebug version, copy that link (in our example http://xdebug.org/files/xdebug-2.2.5.tgz). Then, once logged in to your LAMP VM:
> sudo mkdir /opt/phpfarm/xdebug
> cd /opt/phpfarm/xdebug
> wget http://xdebug.org/files/xdebug-2.2.5.tgz
> tar xzf xdebug-2.2.5.tgz
> cd xdebug-2.2.5
Prepare for Install
This is where the fact that we're using phpfarm slightly changes from the XDebug wizard's advices. As we need to use the correct phpize version to prepare XDebug, instead of “simply” typing phpize, we'll specify the full path of the phpize version to use. In case you modified your .bashrc file as recommended in the phpfarm installation procedure, typing phpize-5.4.4 will suffice:
> sudo /opt/phpfarm/inst/bin/phpize-5.4.4
Configuring for:
PHP Api Version:         20100412
Zend Module Api No:      20100525
Zend Extension Api No:   220100525
Also a little different from the wizard, as we have various versions of PHP installed, we need to explicitly set the configuration file to use:
> sudo ./configure --with-php-config=/opt/phpfarm/inst/bin/php-config-5.4.4
At this step, it is possible you'll get a message saying:
Cannot find autoconf. Please check your autoconf installation and the $PHP_AUTOCONF environment variable. Then, rerun this script.
In this situation simply install autoconf:
> sudo apt-get install autoconf
Then continue with:
> sudo make
> sudo make install
Activate for the Specific PHP Version
Back to following the wizard (step 7):
> sudo cp modules/xdebug.so /opt/phpfarm/inst/php-5.4.4/lib/php/extensions/no-debug-non-zts-20100525
Finally we need to edit the /opt/phpfarm/inst/php-5.4.4/lib/php.ini file to activate the XDebug extension. Oddly enough, this file doesn't seem to be created automatically at install time, but a php.ini file resides at /opt/phpfarm/inst/php-5.4.4/etc/php.ini. We'll copy that file at the place it is expected to be, then add the following lines at the end of the file:
> sudo cp /opt/phpfarm/inst/php-5.4.4/etc/php.ini /opt/phpfarm/inst/php-5.4.4/lib/php.ini
> sudo nano /opt/phpfarm/inst/php-5.4.4/lib/php.ini

----- add this at EOF -----
[xdebug]
zend_extension = "/opt/phpfarm/inst/php-5.4.4/lib/php/extensions/no-debug-non-zts-20100525/xdebug.so"
xdebug.profiler_output_dir = "/tmp/xdebug"
xdebug.trace_output_dir = "/tmp/xdebug"

; additional settings
;xdebug.dump_globals=on
xdebug.collect_params=4
xdebug.collect_vars=on
xdebug.show_local_vars=on
Restart the apache2 Service
You finally have to restart the apache service to have XDebug available with this version of PHP…
> sudo service apache 2 restart
Testing your XDebug
To make sure XDebug is working, you can check the phpinfo(); output that you initialy used to feed the wizard. Reloading the page should now contain an “xdebug section”.
Configuring Apache fcgid Timeout
Running Xdebug will often suspend your scripts execution for a longer period than the default, 40 sec, mod_fcgid read data timeout. That will result in your browser throwing a “500 - Internal Server Error” before you complete the debugging session, also suspending debugging possibilities.
We'll increase the timeout limits by editing the following configuration parameter in /etc/apache2/mods-available/fcgid.conf
> nano /etc/apache2/mods-available/fcgid.conf

ADD:
...
  FcgidConnectTimeout 20
  FcgidIOTimeout 300
...
Don't forget to restart the apache2 service to apply those changes:
> service apache2 restart
Setting up Xdebug’s remote debug with PHPStorm
Edit Your php.ini File
As we already did in the previous step on this page, we edit our php.ini file to enable XDebug's remote debugging feature. Add the following at the end of the file:
> sudo nano /opt/phpfarm/inst/php-5.4.4/lib/php.ini

; remote debug
xdebug.remote_enable=1
xdebug.remote_host=172.20.20.1
xdebug.remote_port=9000
xdebug.idekey="PHPSTORM"
xdebug.remote_autostart=1
xdebug.remote_connect_back=1
xdebug.max_nesting_level=200

SAVE (ctrlX - y)

> sudo service apache2 restart
Configure PhpStorm
(this is for PhpStorm version 7)
Open your PhpStorm settings (ctrl-alt-s), and select Project's Settings > PHP > Debug.
Make sure your Xdebug port is set to the same value as was entered in your php.ini file (here the default 9000).
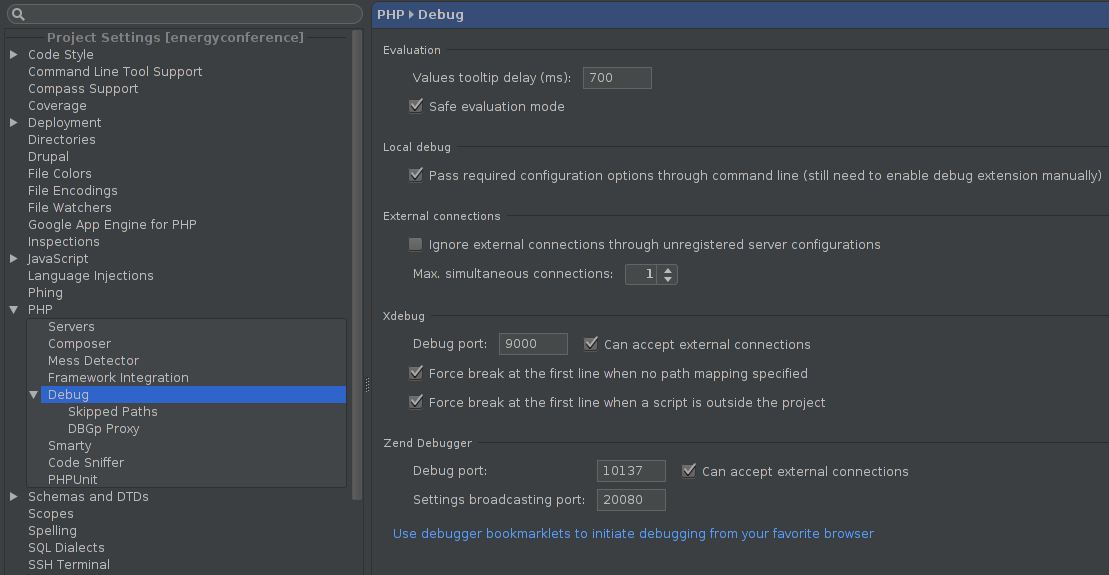
Save those settings and now go to “Run > Edit Configurations”
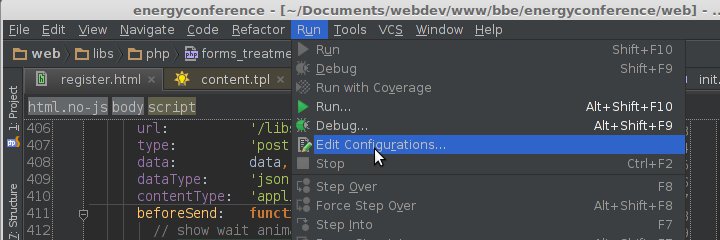
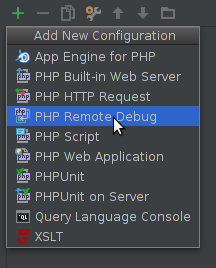
Then create a new PHP Remote Debug configuration:
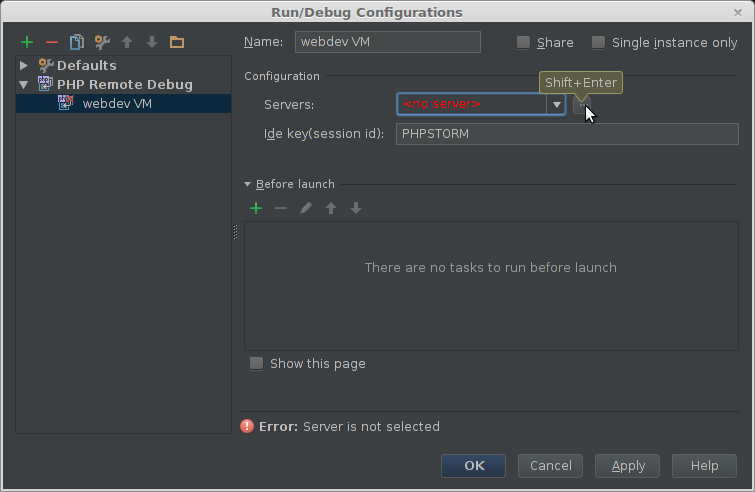
Give this configuration whatever name you see fit, but just make sure the IDE key matches what is in your server's php.ini file, here we use PHPSTORM.
You'll also have to specify a server, you can do this by typing the “…” button next to <no server>, we'll specify our webdev's server IP address and map our local files to the remote server's project root:
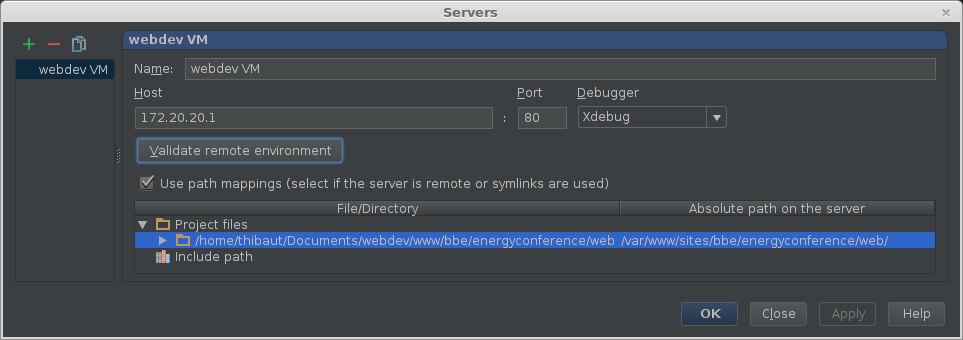
Now put some breakpoints in your php code by clicking in the left margin:

Turn on Xdebug listening by clicking on the appropriate button (it will change icon to indicate it's listening or not):
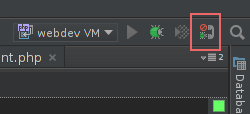

Accessing this script by loading the page in your browser should now stop execution at the breakpoints you placed.
Some Practical Advices
When you are not using xdebug, James Irving-Swift highly recommends that you turn it off on your server, as if your computer is turned off and you access anything that runs PHP via your webserver it will hang as it will be looking for the machine with the IP address specified!
He also recommends that you check out xdebug’s profiler if you haven’t already and use it with a tool like kcachegrind or webgrind. Again, it's recommended that you should turn off profiling when not using it as the files it creates on each page load are vast, you may find you run out of storage very quickly!
Setting up Xdebug’s remote debug with IntelliJ IDEA (14.1.1)
PHP Remote Interpreter plugin:
Settings (Ctrl-Alt-S) > Plugins > Install JetBrains Plugin… (button) > Search (PHP Remote Interpreter) > Install plugin (button)
Then restart IntelliJ IDEA
PHP Interpreter
Settings (Ctrl-Alt-S) > Languages & Frameworks > PHP
Select desired PHP language level.
Interpreter: click “…” button, then green “+” button > Remote…
Enter SSH Credentials, then “…” button next to PHP interpreter path:
Select desired php executable (ex: /opt/phpfarm/inst/php-5.5.23/bin/php)
XDebug config
Settings (Ctrl-Alt-S) > Languages & Frameworks > PHP > Debug
Make sure the Xdebug port is set to the same port as specified in your php.ini file (default: 9000).
Debug Configuration
From top right icons menu of main IntelliJ IDEA's project window, use “down arrow” button (Select Run/Debug configuration), then “Edit configurations…“
Setting up Xdebug’s remote debug with Atom (1.12.5)
Install Atom Package php-debug (0.2.4)
- Open the Atom editor and open settings: Edit > Preferences (ctrl-,)
- Select “Install” from the left menu
- Type “php-debug” in Search packages field, then return to launch the search
- php-debug should appear on top of the list, click the “Install” button
- Read the README that is displayed
For php-debug to be able to give accurate feedback in Atom, you'll need to set the Path Maps in the php-debug settings.
Note that you only need to specify the mapping from your server's root directory to your corresponding local root, your projects sub directories can be inferred from this information.
Configure Xdebug
You have to configure Xdebug for the specific PHP version that you want to debug with, so you'll have to adapt the following with the corresponding location.
In this case we'll configure our PHP version 5.6.27 to debug from Atom. First we'll edit our php.ini file:
> sudo nano /opt/phpfarm/inst/php-5.6.27/lib/php.ini

PASTE AT EOF (removing any existing [xdebug] lines):
[xdebug]
zend_extension = "/opt/phpfarm/inst/php-5.6.27/lib/php/extensions/no-debug-non-zts-20131226/xdebug.so"
xdebug.profiler_output_dir = "/tmp/xdebug"
xdebug.trace_output_dir = "/tmp/xdebug"
; additional settings (atom)
xdebug.remote_enable=1
xdebug.remote_handler=dbgp
xdebug.remote_mode=req
xdebug.remote_host=172.20.20.1
xdebug.remote_port=9000
xdebug.idekey=xdebug.atom
xdebug.remote_autostart=true
xdebug.collect_params=4
xdebug.collect_vars=on
xdebug.show_local_vars=on

> sudo service apache2 restart
To make sure those values have been taken into account, load the phpinfo page created earlier and check the xdebug section to make sure the displayed values are in concordance with the ones you've introduced in the php.ini file.
Remote IP Address
The xdebug.remote_host IP address should be your workstation's IP. In this example we are using a virtualbox VM as development server. In this case, to find out what IP address to use, issue the ip a command from your workstation's command line and look for the inet value of the vboxnet0: interface.
In case you're using Xdebug > 2.1 and your workstation's IP address can vary, you could try to use xdebug.remote_connect_back=true instead of the xdebug.remote_host value. In this case, Xdebug will try to use the $_SERVER['HTTP_X_FORWARDED_FOR'] and $_SERVER['REMOTE_ADDR'] variables to find out which IP address to use. In this case you should not set the xdebug.remote_host parameter in your php.ini.
Xdebug autostart
With xdebug.remote_autostart=true, PHP will connect to your editor for every script it executes, which brings quite an overhead to all your PHP executions on the server. The alternative is to use xdebug.remote_autostart=false, and install an Xdebug helper extension for your browser of choice, such as:
These browser extensions will give you a button within your browser to enable/disable Xdebug.
In case you notice, in the xdebug table of the phpinfo page, that the IDE Key value (right under the version number) is different from the xdebug.idekey value set in the php.ini file, verify the parameters of your browser's xdebug extension.
All Xdebug settings
You can learn more about all possible Xdebug settings in the Xdebug documentation.